
Solar PPC Benchmarks 2026: Why You're Overpaying for Clicks
Stephen Burkhalter13 min read
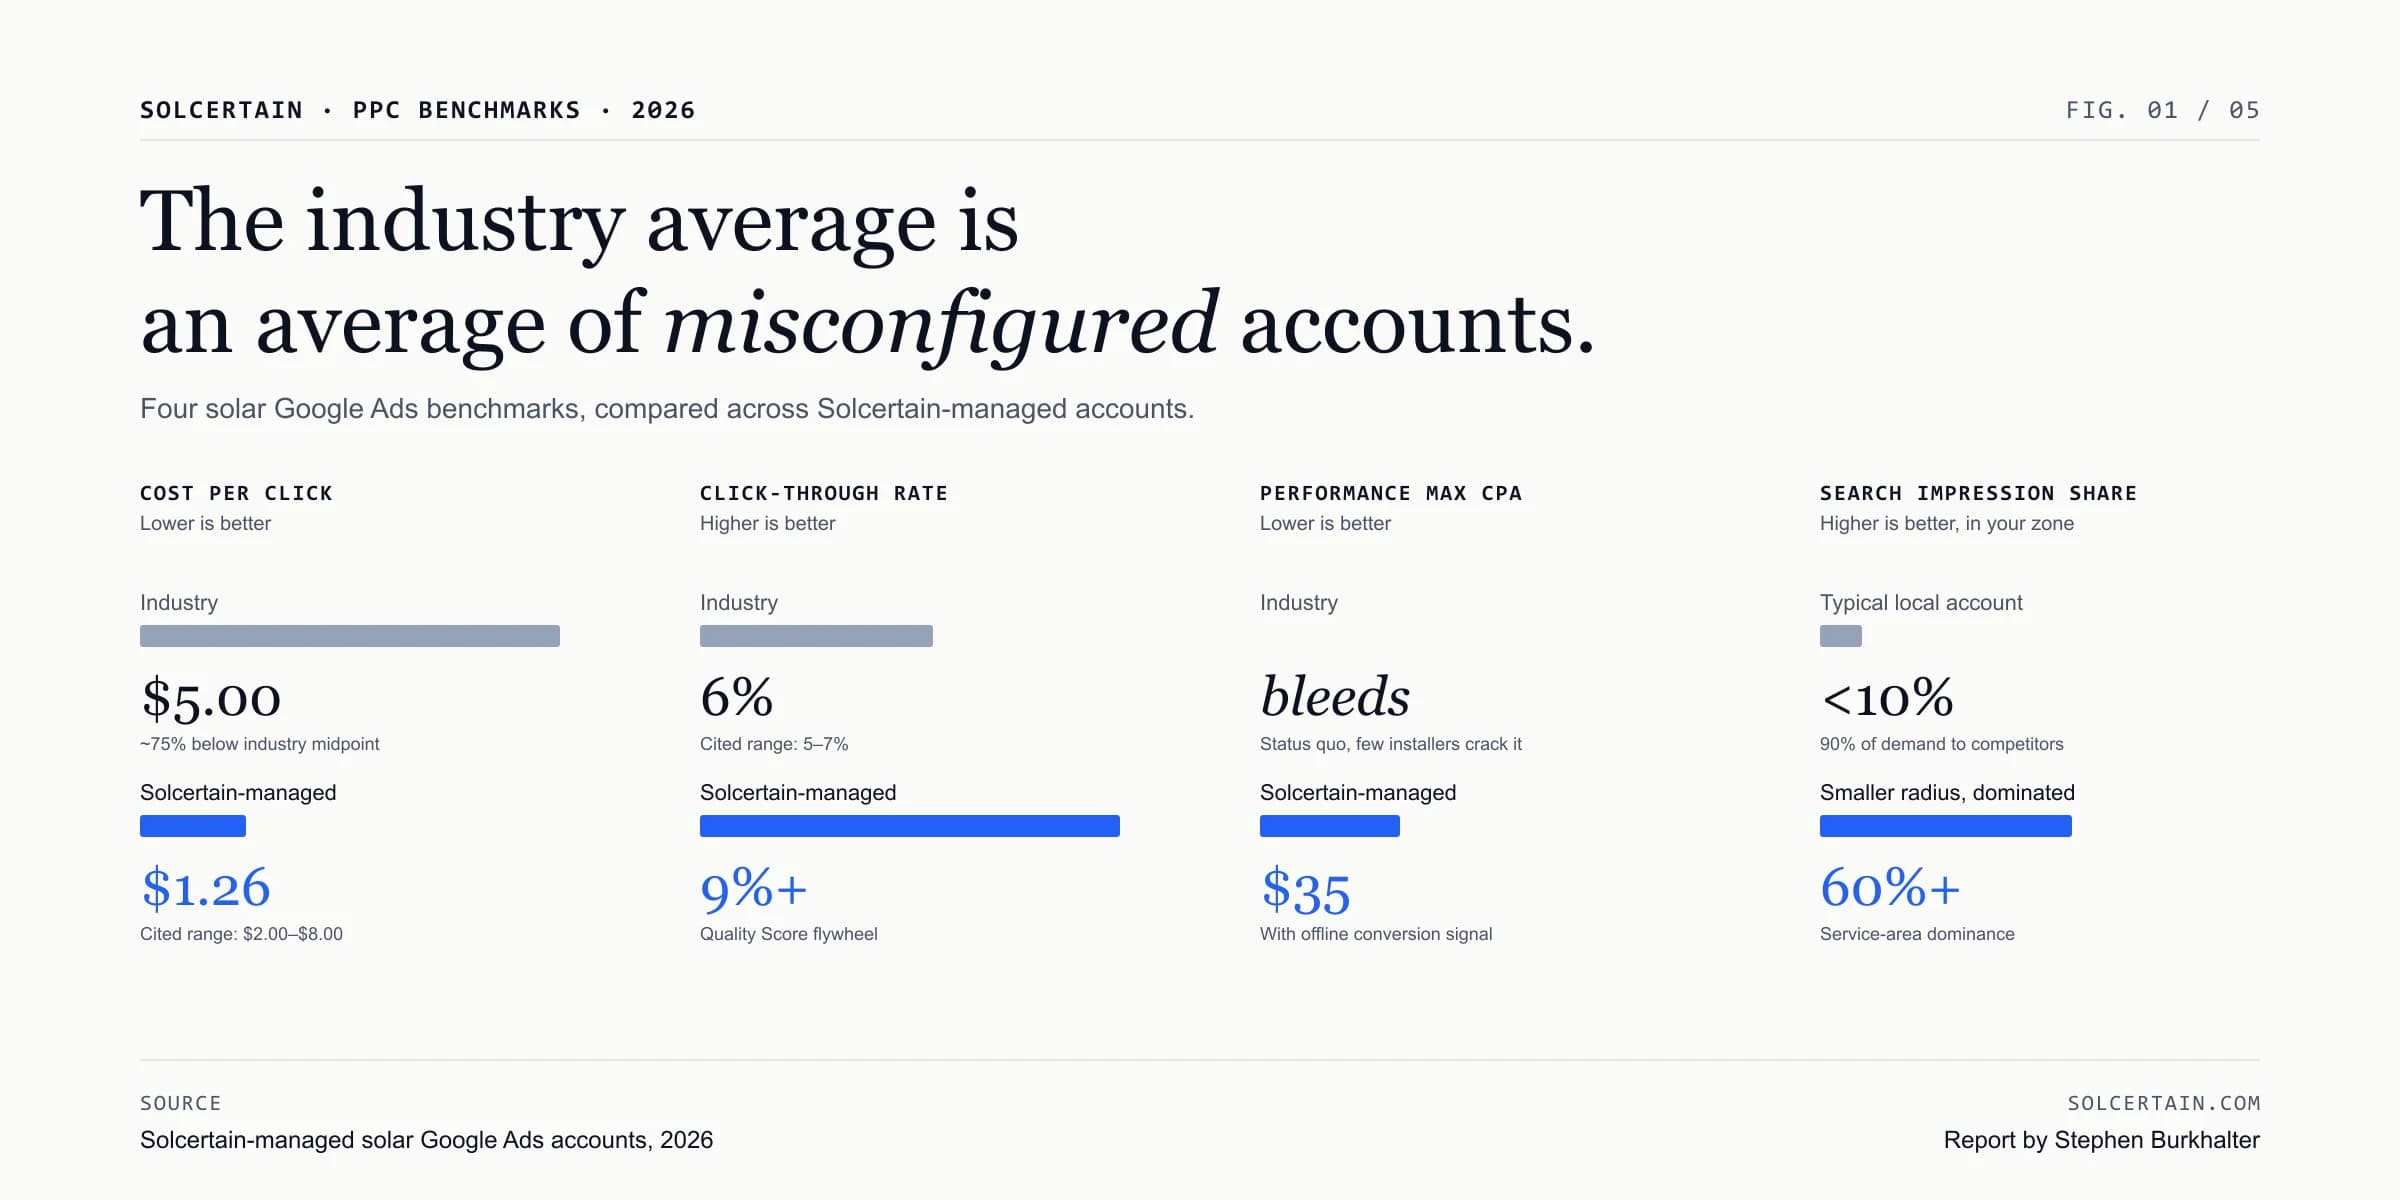
The one-line finding: The "industry average" solar PPC benchmark is an average of a lot of misconfigured accounts. In Solcertain-managed solar Google Ads accounts, CPC runs as low as $1.26, CTR pushes past 9%, and Performance Max delivers a ~$35 CPA. The targeting, tracking and bidding are built for buying intent, not click volume. This report lays out each benchmark, the mechanism behind it, and the steps to audit your own account against it.
If you are a solar installer running Google Ads, you are likely being told by your agency that a $50–$100+ Cost Per Lead (CPL) and a $5.00 Cost Per Click (CPC) is "just the cost of doing business" in the highly competitive solar industry.
Most solar companies accept these industry benchmarks because they don't know any better. They are bleeding ad spend on broad match keywords, poor conversion tracking, and bad bidding strategies.
Based on proprietary data from Solcertain-managed solar Google Ads accounts, the standard industry benchmarks are a myth. If your account is optimized correctly, you can cut your CPC by up to 75% and drive highly qualified leads for a fraction of the cost.
Methodology
- Source. Live Solcertain-managed solar Google Ads accounts, 2026 reporting period. Each account runs on buying-intent keywords for residential solar installers and lead buyers in the United States.
- Scope. Metrics reported are what we observe inside the accounts we manage. They are not meta-analysis of third-party reports.
- What we compare to. The "industry" column reflects ranges cited in major PPC publications and the numbers agencies typically quote back to solar clients in audit calls. The status quo, not a hostile strawman.
- What a comparable account looks like. Exact and phrase match keywords, extensive negative keyword lists, geo-modified ad groups, offline conversion tracking tied to the CRM, and a sales team quick enough to feed back honest signal on lead quality.
- What this is not. These are not guarantees. Results vary by state, season, buyer vs. installer model, and the honesty of the conversion data behind the account. A broken sales process will underperform any benchmark on this page regardless of PPC structure.
Summary: four benchmarks at a glance
| Metric | Industry | Solcertain-managed | Direction |
|---|---|---|---|
| Cost per click (CPC) | $2.00–$8.00 | $1.26 | Lower is better |
| Click-through rate (CTR) | 5–7% | 9%+ | Higher is better |
| Performance Max CPA | Frequently bleeds | ~$35 | Lower is better |
| Search Impression Share (local) | <10% | 60%+ | Higher is better, in your zone |
Each section below covers one row.
Benchmark 1: The Cost Per Click (CPC) myth
Major industry publications generally cite the average CPC for solar campaigns as ranging from $2.00 to $8.00. Most agencies quote the top end of that range back to their clients as a benchmark and move on.
Across our optimized solar audits, we have achieved CPCs as low as $1.26 without sacrificing lead intent.
Two levers do the work:
- Kill the broad match. We restrict targeting heavily to exact and phrase match types to prevent Google from spending budget on informational, non-buying searches (e.g., "how do solar panels work"). Those queries are not worthless, but they are not worth a $5 click paid by a contractor who needs installs this quarter.
- Geo-modified keyword layering. Instead of targeting a broad national area with generic keywords, we use highly specific geo-modifiers (e.g., "solar panels in [City/State]"). The searcher's intent is already narrower before a single dollar is spent on bidding.
Audit your own CPC in 10 minutes
- Open Google Ads → Insights and reports → Search terms. Filter by cost descending. Count how many of the top 20 are informational ("how does," "what is," "cost of," "worth it") vs transactional ("quote," "near me," "installer," "company").
- Open Keywords → Search keywords. Group by match type. If more than 30% of spend is on broad match, that is almost certainly your largest leak.
- Export the search-terms report to a spreadsheet and tag every query with intent. The dollars attached to the informational rows are your first week of savings.
Benchmark 2: Click-Through Rate (CTR) — stop settling for 5%
A "good" CTR in the solar industry typically sits between 5% and 7%. Most of the accounts we audit live at the bottom of that range or below, usually because one ad is trying to cover an entire ad group of loosely related keywords.
By aligning ad copy strictly with user intent, our accounts consistently push past a 9% CTR.
Google rewards high CTRs with a higher Quality Score, which directly lowers the Cost Per Click. By writing ads that directly answer the searcher's query, and utilizing extensive negative keyword lists to filter out junk, we force the CTR up and the CPC down.
The negative-keyword hygiene is where most accounts fail. A healthy solar negatives list strips out "DIY," "jobs," "salary," "stocks," "wholesale," "for sale by owner," and the long list of research-intent modifiers that bloat impressions without improving leads. When CTR climbs and CPC falls at the same time, that's the Quality Score flywheel doing its job — and most agencies never let it start.
Audit your own CTR in 10 minutes
- Open Campaigns → Ad groups and sort by CTR ascending. The bottom five ad groups are almost always too broad: one ad trying to cover a dozen half-related keywords.
- For any ad group under 5% CTR, pull up the ad and read it next to the top three keywords. If the ad does not mention the primary noun the keyword uses, rewrite the ad or split the ad group.
- Open Keywords → Search terms. Add every obvious junk term from the last 30 days to the negatives list at account level. Repeat weekly for a month.
Benchmark 3: Performance Max (PMax) and the $35 lead
While many solar companies struggle to make Google's automated Performance Max campaigns work, our data shows you can achieve a Cost Per Action (CPA) of around $35.
The mistake most installers make: installers fail with PMax because they feed the algorithm "junk" data. They track every single form submission as a conversion, including duplicates, spam, or unqualified traffic. PMax then does its job perfectly, on the wrong objective.
How to fix it:
- Better signals. PMax thrives on data quality, not just volume. You must feed the system qualified-lead and converted-customer signals (offline conversion tracking) so Google learns exactly what a paying customer looks like.
- The conversion threshold. Never switch your campaigns to "Maximize Conversions" bidding until the account is registering at least 20+ unique, high-quality conversions per month. Before that threshold, the algorithm is just guessing.
For most solar installers this means fixing the CRM-to-Google feedback loop before touching the bid strategy. If paid leads live in a spreadsheet or a personal phone, PMax has nothing honest to learn from. Our 2026 CRM maturity report covers how common that gap is across the industry.
Audit your own PMax in 10 minutes
- Open Goals → Conversions → Summary. Count your active conversion actions. If every form, every click-to-call, and every page view is in the list, PMax is being fed noise.
- Set exactly two conversion actions as "primary": qualified lead (CRM-stage) and converted customer. Everything else moves to "secondary" and stops training bidding.
- Open Tools → Measurement → Conversions → Offline conversion imports. If you have never uploaded a file or wired a Zapier-style feed from your CRM, this is step one. Nothing else in PMax can be trusted until this exists.
Benchmark 4: Search Impression Share and dominating local markets
When auditing solar accounts, we consistently see campaigns running with a Search Impression Share below 10%. This means you are leaving 90% of the local demand to your competitors.
The fix: stop spreading a small budget across an entire state. Shrink your targeting radius, dominate the top of the page for high-intent local searches, and capture the market share in your immediate backyard before expanding.
A practical sequence:
- Pick the ZIP codes or counties you can profitably dispatch to today.
- Set bids and budgets so your impression share in those zones climbs to 60%+ on your core keywords.
- Only then widen the radius, and only into zones that pass the same profitability test.
You cannot outspend a national brand in every ZIP. You can outrank them in the three counties you work in, and for most installers that is the whole game.
Audit your own Impression Share in 10 minutes
- Open Campaigns → Columns → Modify columns → Competitive metrics and add Search impression share, Search lost IS (budget) and Search lost IS (rank).
- Pull the last 30 days. If Search IS is under 20% and Search lost IS (rank) is in double digits, your account is being outranked, not outspent — the fix is Quality Score (Benchmarks 1 & 2), not budget.
- If Search lost IS (budget) is high and Search IS is still low, your map is too wide for your budget. Cut the geo-targets to the zones you can actually dispatch to and reassign the budget.
What these numbers assume
None of the benchmarks above work without the fundamentals under them: accurate conversion tracking (the real kind, not "any form submission counts"), disciplined negative-keyword hygiene, landing pages that match the ad, and a sales team that calls the leads quickly enough to feed honest signal on quality back to Google.
Results will vary by state, season, and the honesty of the conversion data. These are the ranges we see across managed accounts, not guarantees.
If you want the same quality of lead without running the ad account yourself, we also sell exclusive solar leads and pre-set solar appointments generated from the same funnel.
Book a PPC audit
Stop guessing and stop wasting ad spend. Book a PPC audit and we'll walk through your match types, your negative lists, your conversion signals, and your impression share, and tell you what to fix first.
Want leads like the ones in this guide?
Solcertain generates exclusive, verified residential solar leads for one company per territory, delivered in real time.
Want to do this yourself? Join the free Lead Lab, our community for generating your own leads.